
Observability for LLM Applications: How to Track Logs, Traces, Costs, and Failures
July 13, 2026
Large language model applications are no longer simple “prompt in, answer out” systems. Modern LLM products often behave like distributed systems: they call tools, retrieve documents, loop through agent steps, retry failed requests, stream partial outputs, and hand work off to downstream services. That makes them powerful, but it also makes them harder to debug, monitor, and control. OpenTelemetry describes observability as a vendor-neutral framework for instrumenting and exporting telemetry such as traces, metrics, and logs, and it has become a natural fit for GenAI workloads as well. (opentelemetry.io)
For teams shipping LLM-powered features, observability is not just a “nice to have.” It is how you answer practical questions like: Why did this response take 18 seconds? Which tool call caused the slowdown? How many tokens did this request burn? Why did an agent get stuck in a retry loop? Did a retrieval step inject irrelevant context? These are the kinds of hidden failure modes that traditional application monitoring often misses, especially when the work happens inside model calls rather than in explicit code paths. OpenTelemetry’s GenAI semantic conventions are designed to expose those operations in a standardized way, including model, token, prompt, completion, and tool-call context. (opentelemetry.io)

1. Why LLM observability matters now: agents, tool calls, latency, and hidden failure modes
LLM applications have changed the shape of production incidents. In a traditional web app, a request usually maps to a known sequence of database queries, API calls, and business rules. In an agentic LLM app, a single user request can trigger multiple model invocations, several tool calls, retrieval lookups, safety filters, and conditional branching. That means the root cause of a bad outcome may be buried several steps away from the user-facing response. OpenTelemetry’s GenAI guidance explicitly calls out the need to observe the chain of model calls, tool invocations, and token exchanges behind the scenes. (opentelemetry.io)
This matters because the major failure modes are often indirect. A response may be slow because the model is fine but a downstream tool is timing out. A conversation may spiral because one tool returns malformed JSON and the agent retries repeatedly. A customer may receive a plausible but wrong answer because retrieval selected the wrong source document. Or the system may appear healthy while costs quietly explode due to a prompt change that doubled token usage. These are operational failures, but they are also product failures and sometimes safety failures. OpenTelemetry’s logging guidance also notes that active traces and spans can be correlated with existing logs, which is essential for reconstructing these multi-step incidents. (opentelemetry.io)
The other reason observability matters now is that LLM systems are increasingly heterogeneous. Many teams use multiple providers, internal models, hosted models, and agent frameworks together. Without a common instrumentation layer, the team ends up with fragmented dashboards and inconsistent field names. OpenTelemetry’s semantic conventions exist precisely to standardize naming across codebases and platforms, and the GenAI conventions are intended to help cross-vendor instrumentation identify things like the provider, request model, response model, and token usage in a consistent way. (opentelemetry.io)
2. Core telemetry signals for LLM apps: logs, traces, metrics, and how they relate to prompts and sessions
The three core signals still apply to LLM systems: logs tell you what happened, traces show how a request flowed through components, and metrics reveal aggregate behavior over time. OpenTelemetry defines semantic conventions for spans, metrics, logs, and events, making it easier to correlate these signals across systems. In practice, an LLM request should be observable at three levels at once: the individual prompt/completion exchange, the end-to-end workflow, and the aggregated service health. (opentelemetry.io)
Logs are best for detailed records. In an LLM app, logs may capture prompt metadata, model version, tool results, retrieval document IDs, safety classifications, and structured error details. Traces are best for causality. A user request can become a root span, with child spans for retrieval, model calls, tool executions, re-ranking, post-processing, and retries. Metrics are best for trends and thresholds: request latency, token counts, error rate, tool-call failures, and usage per model or tenant. OpenTelemetry’s logs documentation also notes that log entries can be correlated with active trace and span IDs, which makes it easier to jump from a latency spike to the exact request that caused it. (opentelemetry.io)
Sessions deserve special mention. LLM apps often have a user session, conversation thread, or agent task that spans multiple requests. The most useful observability setups attach session identifiers, conversation IDs, and workflow IDs to telemetry so that you can reconstruct a multi-turn interaction end to end. That lets you answer questions such as: did the user’s second message trigger a retrieval step that changed the model behavior? Did the tool output in turn three cause the agent to drift? Did the final answer only fail after a series of individually “successful” steps? OpenTelemetry’s general semantic conventions support session-related data, and the GenAI conventions provide a common vocabulary for model operations and inputs/outputs. (opentelemetry.io)
3. OpenTelemetry as the emerging standard for GenAI observability and cross-vendor instrumentation
OpenTelemetry is becoming the practical baseline for GenAI observability because it gives teams a vendor-neutral way to instrument and export telemetry. Its documentation describes OTel as an open source observability framework for traces, metrics, and logs, and it is supported by a broad ecosystem of vendors and integrations. That matters in LLM projects because the stack often changes quickly: teams may switch providers, add new frameworks, or route traffic through different model gateways. A standard telemetry layer reduces the cost of those changes. (opentelemetry.io)
The most important GenAI development is the OpenTelemetry GenAI semantic conventions. These define a common set of attributes for generative AI operations, including provider, request model, response model, output type, and other fields that help normalize telemetry across systems. The GenAI conventions are explicitly intended to help different providers and hosting platforms be observed in a comparable way, even when the underlying API or runtime differs. That cross-vendor portability is crucial for teams building multi-model products or maintaining fallback logic across providers. (opentelemetry.io)
This standardization also matters for tooling. If one service emits model usage as llm_tokens_in, another as input_tokens, and a third as a proprietary field in a JSON blob, dashboards and alerts become brittle. With OTel, those signals can be normalized into common semantic fields and exported to whatever backend the team prefers. OpenTelemetry’s own documentation emphasizes that semantic conventions are the common naming scheme that allows easier correlation and consumption of data across codebases and platforms. (opentelemetry.io)
In other words, OpenTelemetry is not just a tracing library for LLM apps. It is a portability layer for observability itself. For organizations trying to avoid lock-in while still capturing high-value GenAI telemetry, that is a strong position to be in. (opentelemetry.io)
4. What to log in production: prompts, completions, tool calls, retrieval context, errors, and safety events
Production logging for LLM systems should be deliberate, not exhaustive. The goal is to capture enough context to diagnose behavior without collecting unnecessary sensitive data or creating avoidable compliance risk. OpenTelemetry’s GenAI blog notes that when opted in, telemetry can include the full content of prompts, completions, tool calls, and tool results. That “opt-in” framing is important: teams should make content logging configurable and apply redaction, hashing, or sampling where appropriate. (opentelemetry.io)
A good production log record usually includes the prompt template or prompt ID, the model name, the request/session ID, token counts, latency, and the final outcome. If the app uses retrieval, log the top-k document IDs, the retrieved passage identifiers, and the ranking or filtering steps that were applied. If tool use is involved, log the tool name, input arguments, output summary, execution time, and any error returned. For safety and policy systems, log the event type, the classifier or rule that fired, and the action taken, such as block, redact, escalate, or allow. OpenTelemetry’s semantic conventions are designed to cover spans, logs, metrics, and events, which makes this sort of structured logging easier to normalize. (opentelemetry.io)
It is also wise to log the version of the prompt, agent policy, embedding model, retrieval index, and post-processing pipeline. Many LLM regressions come from “small” changes: a revised system prompt, a new chunking strategy, or a silent model upgrade. If those versions are not captured in telemetry, the team may know that behavior changed but not why. The broader OpenTelemetry guidance recommends identifying important characteristics of an operation, including target, input parameters, and result properties, which maps cleanly onto GenAI production logging. (opentelemetry.io)
Finally, remember that logs are not only for debugging. They are also the foundation of auditing and incident review. Safety events, prompt injection detections, policy blocks, and abnormal user patterns all become much easier to investigate when they are consistently recorded and correlated to the exact request flow. (opentelemetry.io)
5. Tracing LLM workflows end to end: multi-step chains, agent loops, retried calls, and downstream dependencies
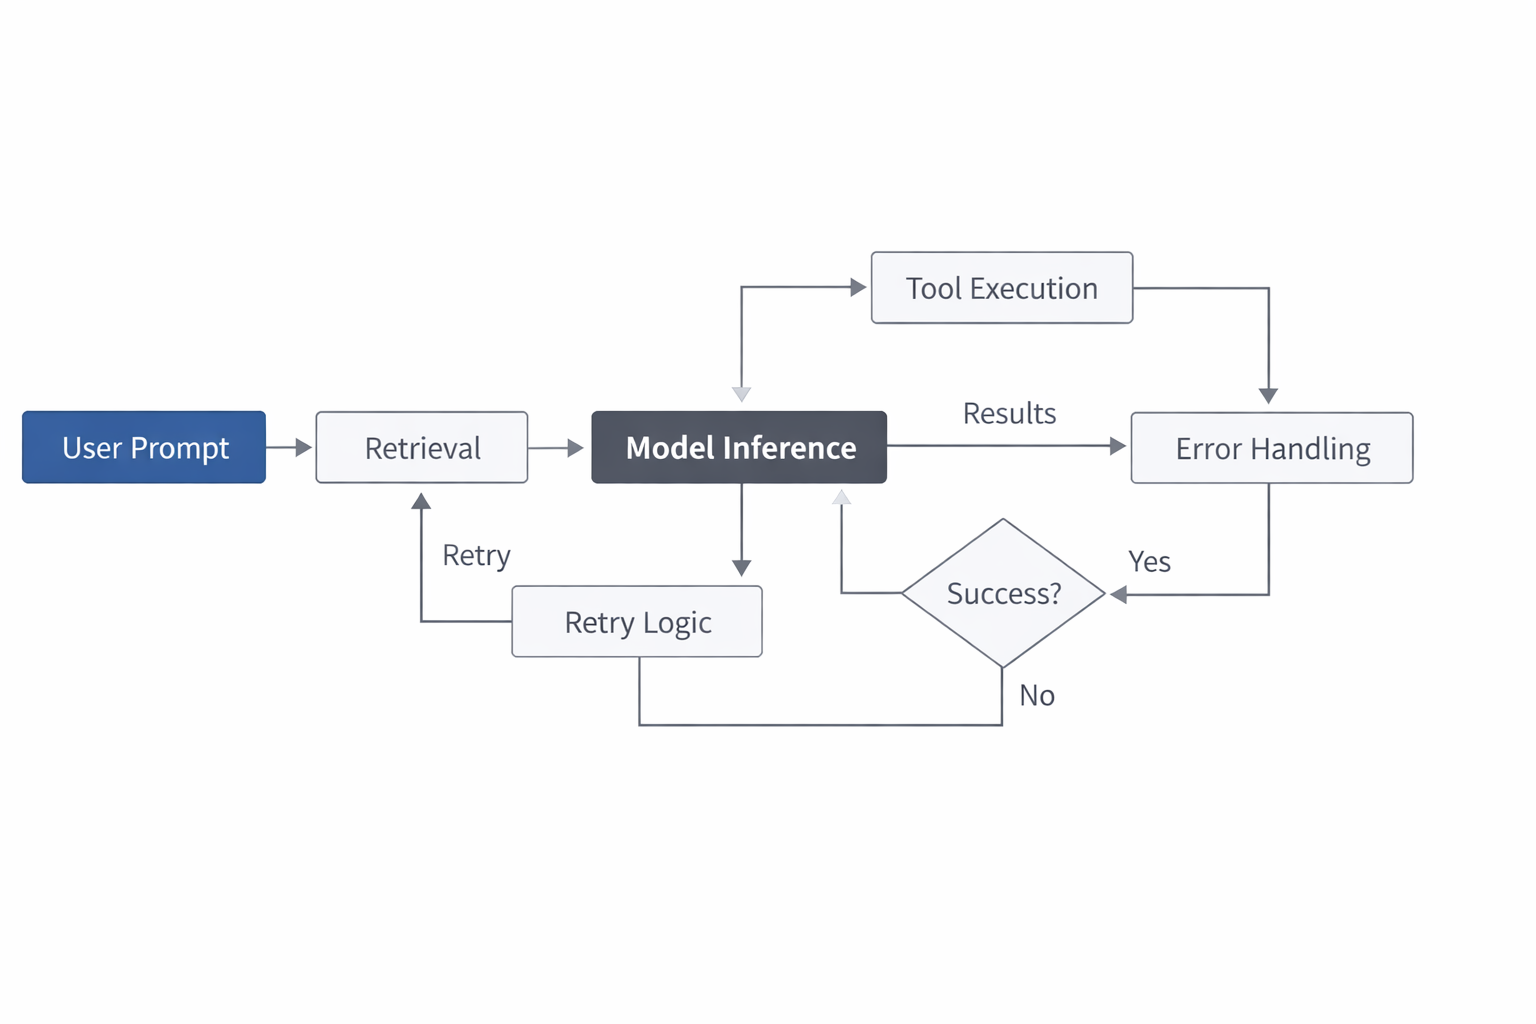
Tracing is where LLM observability becomes truly powerful. A trace turns a scattered set of LLM activities into a single story. The root span usually represents the user-facing request or task, and child spans represent the steps inside that task: retrieval, planning, model invocation, tool execution, response formatting, validation, and delivery. OpenTelemetry’s semantic conventions are built to describe operations and their targets, and the GenAI conventions add model-specific context so those spans are meaningful rather than generic. (opentelemetry.io)
This is especially useful for agent loops. Agents may plan, call a tool, inspect the result, decide whether the result is sufficient, and repeat several times. Without tracing, you may only see a slow request or a bad answer. With tracing, you can see whether the agent spent five iterations trying to accomplish a simple task, whether a tool was repeatedly failing, or whether the model kept selecting the wrong branch. OpenTelemetry’s tracing model and logs correlation make it easier to connect those steps to concrete errors or warnings emitted along the way. (opentelemetry.io)
Retries deserve explicit spans too. A model request that fails once and then succeeds on retry might look healthy from the outside, but repeated retries can create latency spikes and hidden cost growth. Similarly, downstream dependencies such as vector databases, search APIs, identity services, and payment systems should appear in the trace if they participate in the LLM workflow. This helps teams determine whether the bottleneck is the model, the prompt, the retrieval layer, or an unrelated service. OpenTelemetry guidance also encourages including network-related attributes on spans that describe network calls, which is useful for tool and dependency tracing. (opentelemetry.io)
A mature trace in an LLM app should answer three questions quickly: what happened, where time was spent, and which dependency caused the issue. If your tracing setup does that, incident response becomes much faster and much less speculative. (opentelemetry.io)
6. Cost observability: token usage, model comparisons, per-request spend, and forecasting runaway usage
LLM cost can drift in subtle ways. A prompt that is a little longer, a response that is a little more verbose, or a tool loop that runs one extra iteration can add up quickly at scale. That is why cost observability should be treated as a first-class operational concern rather than a finance report generated after the fact. OpenTelemetry’s GenAI blog specifically points to token usage metrics as a way to estimate per-request cost, catch token-hungry prompts, detect latency regressions, and monitor usage across models and agents. (opentelemetry.io)
The fundamental metric is token usage, split by input and output. The OpenTelemetry GenAI examples describe metrics such as gen_ai.client.token.usage, with filters like gen_ai.token.type to separate input from output tokens, and latency metrics such as gen_ai.client.operation.duration. Those metrics are valuable because they let you compare models on both quality and efficiency. One model may be more accurate, but if it uses twice as many tokens for the same task, the business tradeoff may be unfavorable. (opentelemetry.io)
Per-request spend is often the most actionable cost metric. Once token counts and model pricing are known, the team can estimate the cost of each request, session, or workflow. That makes it possible to build dashboards by tenant, feature, customer segment, or agent type. It also helps identify runaway usage patterns, such as a single customer creating unusually large sessions or a prompt regression triggering much longer completions. Because OpenTelemetry is vendor-neutral, these metrics can flow into whatever backend or warehouse the organization already uses. (opentelemetry.io)
Forecasting is the next step. Once you have token and latency distributions, you can extrapolate expected spend based on traffic growth, prompt changes, or model swaps. That turns cost management into an engineering discipline: set budgets, observe actual burn, and detect anomalies before the bill arrives. In LLM systems, cost is not merely an accounting issue; it is a reliability and product issue too. (opentelemetry.io)
7. Failure analysis and reliability: hallucinations, timeout cascades, rate limits, malformed tool output, and prompt injection
Reliability in LLM applications is not just about whether the service returned a response. It is about whether the response was useful, safe, timely, and grounded in the right context. Observability helps distinguish among different kinds of failure. A hallucination is not the same as a timeout, and a timeout is not the same as a malformed tool payload. Yet all three may surface to users as “the AI didn’t work.” Good telemetry is what lets you separate these cases. (opentelemetry.io)
Timeout cascades are common in agentic workflows. If retrieval is slow, the model may be slow. If the model is slow, downstream tools may time out because the overall request budget has been consumed. If one tool times out, the agent may retry and make the whole process even slower. Traces are ideal for revealing this chain of cause and effect. In parallel, logs should capture structured timeout details, retry counts, and fallback behavior so engineers can see whether the system degraded gracefully or simply failed. OpenTelemetry’s logs and trace correlation make this kind of postmortem much easier. (opentelemetry.io)
Rate limits and malformed tool output are similarly important. A model may be functioning normally while a tool backend is throttling requests, returning invalid JSON, or changing its schema unexpectedly. If your agent assumes a strict output format, even a tiny deviation can break the workflow. Logging tool inputs and outputs, plus tracing the tool span and retry span, is often enough to pinpoint the issue quickly. OpenTelemetry’s GenAI and general semantic guidance encourages recording the important parameters and result properties of an operation, which fits tool execution well. (opentelemetry.io)
Prompt injection deserves special attention because it is both a safety and an integrity problem. If user-supplied content or retrieved documents can influence system instructions, the app needs to detect and record those events. Safety logs should note when a prompt is flagged, which policy or classifier triggered, and what action was taken. That information is essential for both security review and prompt hardening. The more agentic the system becomes, the more important it is to watch for these adversarial or accidental instruction conflicts. (opentelemetry.io)
8. Quality and evaluation workflows: online evaluation, regression testing, and prompt/model change validation
Observability is only useful if it feeds evaluation. In LLM systems, “it works on my machine” is rarely enough, because behavior changes with prompt wording, retrieved context, temperature, tool availability, and model version. That is why teams should connect telemetry to evaluation workflows that measure quality continuously, not just during development. OpenTelemetry’s standardized signals help here because they make it easier to compare runs over time and across environments. (opentelemetry.io)
Online evaluation means scoring real production traffic using sampled telemetry, human review, automated graders, or downstream business outcomes. For example, you can sample conversations, score answer relevance, measure tool success rates, or compare response quality across model variants. Regression testing uses a fixed set of prompts and scenarios to catch quality drift after a prompt update, retrieval change, or model swap. The key is to make telemetry rich enough that evaluation results can be tied back to exact prompt versions, model versions, and workflow paths. (opentelemetry.io)
Validation after prompt or model changes should be treated like a release gate. Before promoting a new prompt, compare latency, token usage, refusal rates, tool-call counts, and quality scores against the baseline. If one version is cheaper but less accurate, the tradeoff should be visible. If a new model is more accurate but consistently slower, that should show up in traces and metrics before it reaches all users. OpenTelemetry’s emphasis on consistent naming and cross-platform correlation makes that style of comparison much more practical. (opentelemetry.io)
In mature teams, observability and evaluation become a feedback loop. Telemetry identifies the cases that matter, evaluation explains whether they are good or bad, and release controls decide whether a change should ship. That is the difference between reactive debugging and deliberate model operations. (opentelemetry.io)
9. Dashboards and alerting: SLOs, anomaly detection, and operational views for incident response
Dashboards for LLM applications should look different from classic API dashboards. You still want request rate, latency, and errors, but you also need model-centric and workflow-centric views. Useful panels often include token consumption over time, cost per request, prompt version distribution, tool success rate, retrieval hit rate, fallback frequency, and error breakdown by model or agent. Because OpenTelemetry is signal-agnostic and vendor-neutral, these views can be built in many backends without changing instrumentation. (opentelemetry.io)
Service-level objectives are especially important. An LLM app may have an availability SLO, but it should also have SLOs for p95 latency, tool success rate, grounded-answer rate, or safe-completion rate. The exact objectives depend on the product, but the point is the same: if users experience slowness, failed tool calls, or ungrounded answers, the team should know before the issue becomes visible in support tickets. OpenTelemetry metrics give the raw material for those alerts, and logs and traces give the context when an alert fires. (opentelemetry.io)
Anomaly detection is particularly helpful for cost and quality drift. A sudden increase in output tokens may mean a prompt changed. A spike in retried calls may indicate a downstream tool is failing. A jump in safety blocks might indicate prompt injection attempts or a policy regression. The goal is not just to alert on failures, but to surface meaningful deviations in system behavior early. OpenTelemetry’s support for correlation across logs, traces, and metrics makes it possible to move from a red chart to a specific trace and log record quickly. (opentelemetry.io)
For incident response, the best dashboards are operational rather than decorative. They should answer: what changed, where is the bottleneck, how much is it costing, and what user impact is likely? In LLM systems, that can save hours of guesswork. (opentelemetry.io)
10. Implementation checklist and future trends: standardized GenAI telemetry, vendor tools, and what teams should adopt next
If you are starting from scratch, the implementation path should be pragmatic. First, choose a telemetry standard. OpenTelemetry is the strongest default because it is vendor-neutral, broadly supported, and already has GenAI semantic conventions underway. Second, instrument the request boundary so every LLM interaction gets a trace with session and workflow identifiers. Third, add structured logs for prompts, completions, tool calls, retrieval context, and errors, while making sensitive content opt-in or redacted. Fourth, emit metrics for token usage, latency, retries, safety events, and tool success rates. Fifth, create dashboards that combine operational health with cost and quality indicators. (opentelemetry.io)
A practical checklist might look like this:
Add a root span for every user request or agent task.
Propagate session, conversation, tenant, and workflow IDs.
Record model name, provider, and prompt version.
Capture token counts and latency for each model call.
Trace each retrieval, tool call, retry, and fallback.
Log errors, policy blocks, and safety events in structured form.
Redact or hash sensitive prompt content by default.
Build cost dashboards by model, feature, and tenant.
Set alerts for latency, retry spikes, token surges, and safety anomalies.
Validate every prompt or model change against a baseline. (opentelemetry.io)

Looking ahead, GenAI telemetry is likely to become more standardized, more cross-vendor, and more directly tied to evaluation and governance. OpenTelemetry’s GenAI conventions are still developing, but the direction is clear: consistent attributes for AI operations, wider support across tools, and better correlation between operational data and product quality. Teams that adopt these patterns early will have an easier time switching vendors, investigating incidents, and proving reliability as their LLM usage grows. (opentelemetry.io)
Conclusion
LLM observability is about more than watching API latency. It is about understanding the full behavior of a system that plans, retrieves, calls tools, retries, and responds in ways that are often invisible without good telemetry. Logs tell you what happened, traces show you how it happened, and metrics reveal whether the system is getting faster, slower, more expensive, or less reliable over time. OpenTelemetry is emerging as the best foundation for that work because it provides a vendor-neutral framework and increasingly useful GenAI semantic conventions. (opentelemetry.io)
The main takeaway is simple: if you run LLM applications in production, you need observability that is designed for LLM behavior, not retrofitted onto it. Start with structured telemetry, standardize your fields, trace the full workflow, measure cost in tokens and dollars, and connect production signals to evaluation and release decisions. Teams that do this well will debug faster, spend less, and ship safer AI features with much more confidence. (opentelemetry.io)